For the two queries which look almost identical
select max(ln(i))::int m from generate_series(1, 1e6) i;
and
select max(ln(i))::int m from generate_series(1, 1e6::int) i;
the execution time differs by orders of magnitude (0.3 sec vs 11+ sec).
Let’s see why and dive into some internals.
The first step of our investigation is to build query plans with runtime executions statistics.
postgres=# explain (analyze, verbose)
postgres-# select max(ln(i))::int m from generate_series(1, 1e6::int) i;
                                                                     QUERY PLAN
-----------------------------------------------------------------------------------------------------------------------------------------------------
 Aggregate  (cost=17500.00..17500.01 rows=1 width=4) (actual time=323.302..323.302 rows=1 loops=1)
   Output: (max(ln((i)::double precision)))::integer
   ->  Function Scan on pg_catalog.generate_series i  (cost=0.00..10000.00 rows=1000000 width=4) (actual time=116.031..221.038 rows=1000000 loops=1)
         Output: i
         Function Call: generate_series(1, 1000000)
 Query Identifier: -9203565244387907532
 Planning Time: 0.052 ms
 Execution Time: 329.010 ms
(8 rows)
postgres=# explain (analyze, verbose)
postgres-# select max(ln(i))::int m from generate_series(1, 1e6) i;
                                                                   QUERY PLAN
------------------------------------------------------------------------------------------------------------------------------------------------
 Aggregate  (cost=15.00..15.01 rows=1 width=4) (actual time=11156.021..11156.022 rows=1 loops=1)
   Output: (max(ln(i)))::integer
   ->  Function Scan on pg_catalog.generate_series i  (cost=0.00..10.00 rows=1000 width=32) (actual time=211.914..357.341 rows=1000000 loops=1)
         Output: i
         Function Call: generate_series('1'::numeric, '1000000'::numeric)
 Query Identifier: -1723699617470658334
 Planning Time: 0.057 ms
 Execution Time: 11162.142 ms
(8 rows)
So the first query is more than 30 times faster because argument type for ln function has double precision type while in the second case it is numeric. This is the key difference but not the only one.
For example, generate_series takes around 50% more time to generate series of numeric type than a series of integers (357ms vs 221ms).
The root cause is pretty obvious at this point but let’s go a bit further and check where exactly time is spent internally.
In order to do that we will profile execution with perf and visualize output with Flame Graphs.
Let’s profile running session for 15 seconds with 99 frames per second.
sudo perf record -F 99 -g -p <pid> -- sleep 15
Once execution is completed perf generates file perf.data. Let’s generate a trace for each execution and rename them correspondingly to slow.data and fast.data.
Once we have raw traces we need to do three steps
sudo perf script -i slow.data > slow.perf
stackcollapse-perf.pl slow.perf > slow.folded
flamegraph.pl slow.folded > slow.svg
First step converts raw (binary) trace into readable trace of function calls. Second step aggregates calls and finally third step generates visualization.
Use these links to view details of fast and slow executions interactively.
We can generate the difference (interactive mode – diff) with
difffolded.pl fast.folded slow.folded | flamegraph.pl --title "ln - double precision vs numeric" --colors diff > diff.svg
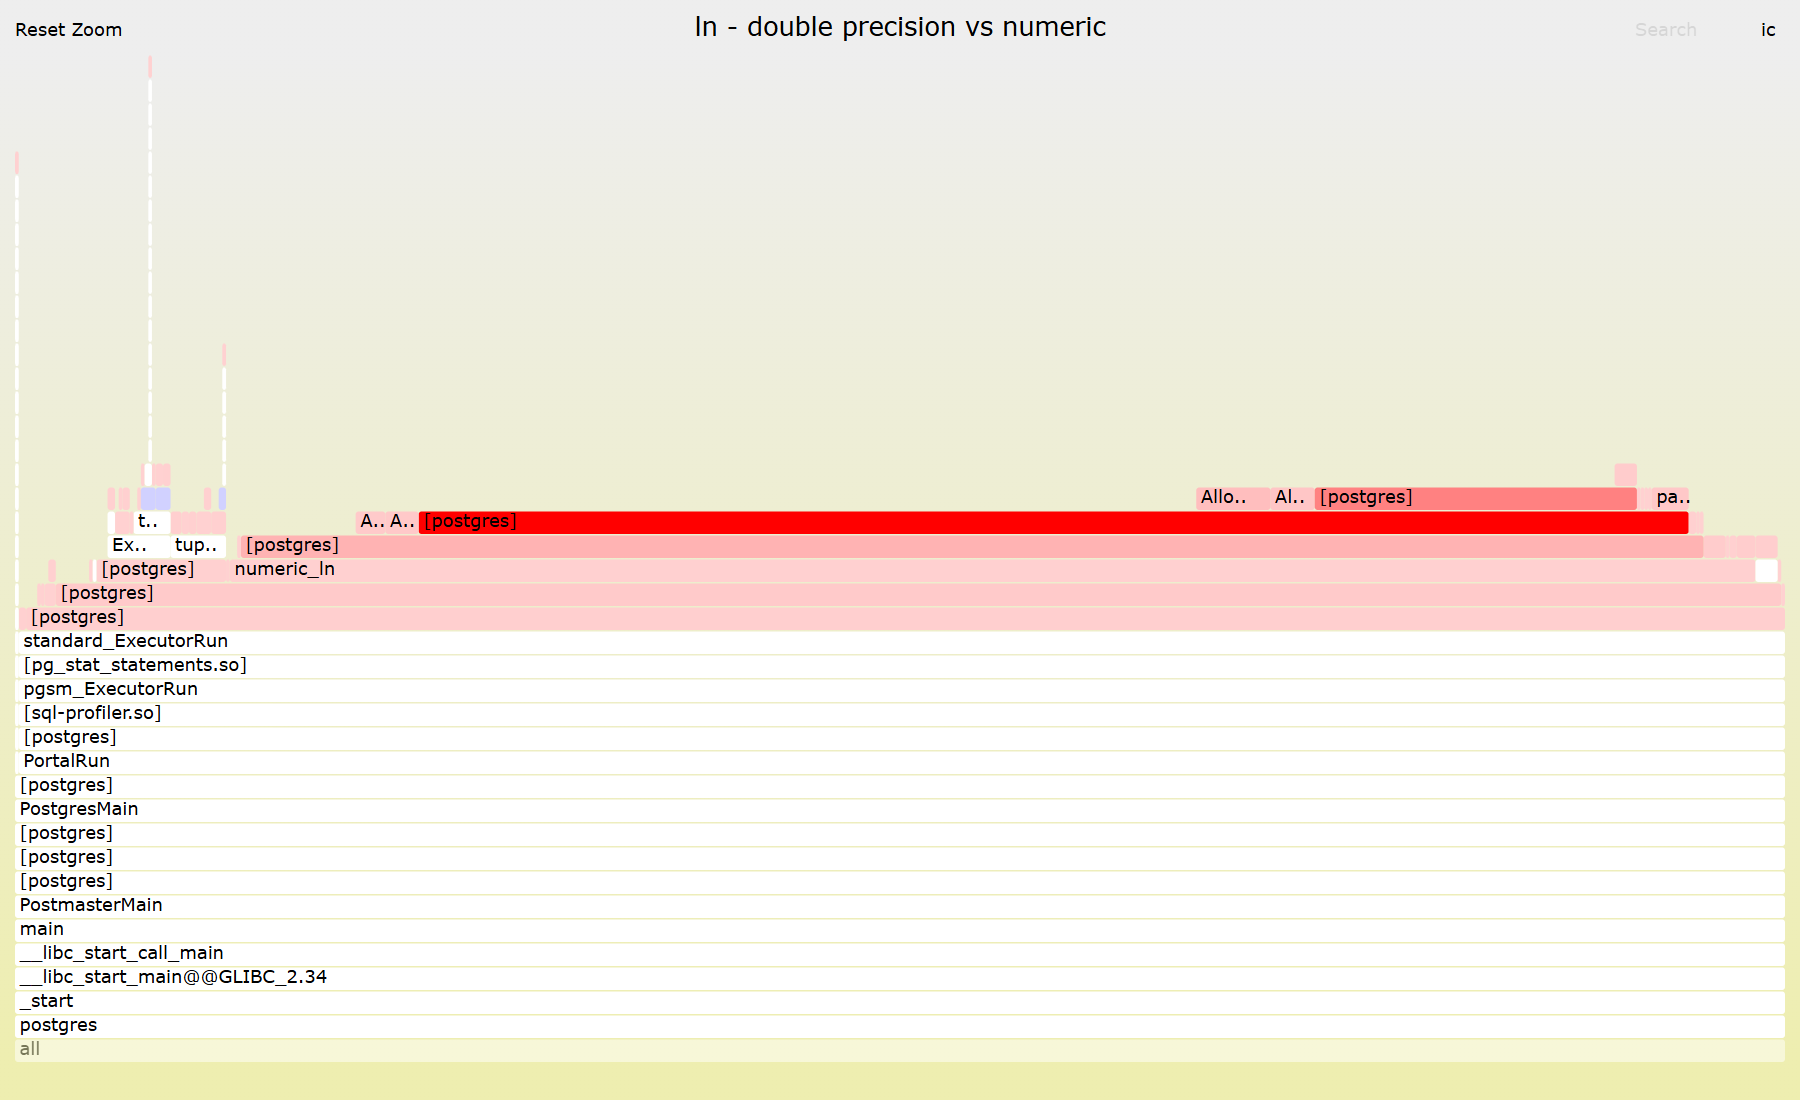
In fast execution most of the time was spent on ExecMakeTableFunctionResult/tuplestore_gettupleslot. Which indicates that math is so cheap so executor + tuplestore overhead dominates.
In slow execution though ExecMakeTableFunctionResult/tuplestore_gettupleslot takes just a small fraction of overall time. More than 86% of CPU is spent on numeric_ln. In addition to computation itself a significant part of additional cost comes from extra calls to AllocSetAlloc/AllocSetFree reflecting memory management overhead for PostgreSQL numeric type.
Finally you can compare all internal mechanics in detail by checking out the source code – numeric_ln vs dlog1.
In order to confirm that it is actually dlog1 I had to increase number of rows from 1e6 to 1e7 and change number of samples from 99 to 999. Eventually you can see this function in the new trace.
$ sudo perf report -i perf.data --stdio --no-children | grep -E 'log|ln'
     5.33%  postgres  libm.so.6             [.] __ieee754_log_fma
            ---__ieee754_log_fma
     3.65%  postgres  postgres              [.] dlog1
            ---dlog1
     0.76%  postgres  libm.so.6             [.] log@@GLIBC_2.29
            ---log@@GLIBC_2.29
     0.46%  postgres  libm.so.6             [.] __log_finite@GLIBC_2.15@plt
     0.29%  postgres  postgres              [.] log@plt
So performance drastically differs between numeric and double precision types and one should choose wisely which one is actually needed for a given task.
